Short selling involves significant risk. These signals identify potential stress, not guaranteed declines. Always conduct thorough due diligence before any investment decision.
The Perfect Storm
Most companies have some distress language. The red flags appear when multiple signals fire simultaneously: revenue declining, costs being cut, expectations being missed, and management using hedging language.
Interpretation: Scores above 100 indicate the "danger zone" where multiple distress signals are elevated. Biotech/pharma excluded (naturally high distress language).
Signal Detection Pipeline
Top Short Candidates
Companies with the highest storm scores—multiple distress signals firing simultaneously.
| Ticker | Company | Storm Score | Rev Declining | Cost Cutting | Net Beat |
|---|---|---|---|---|---|
| DDD | 3D Systems Corp | 117.8 | 34.9% | 47.7% | -0.0 |
| VFC | V.F. Corp | 116.4 | 34.0% | 40.5% | -2.3 |
| XRX | Xerox Holdings | 114.5 | 33.6% | 46.4% | +0.1 |
| CF | CF Industries | 113.2 | 33.1% | 50.0% | +3.2 |
| MXL | MaxLinear | 112.9 | 27.9% | 42.1% | -4.3 |
| UPS | United Parcel Service | 112.0 | 32.4% | 47.8% | +0.3 |
| DOW | Dow Inc. | 108.9 | 29.6% | 45.0% | -1.0 |
| MAN | ManpowerGroup | 105.5 | 30.3% | 42.9% | +0.3 |
| HAIN | Hain Celestial | 104.0 | 26.2% | 38.4% | -3.0 |
| IRBT | iRobot Corp | 99.9 | 27.8% | 44.6% | +1.4 |
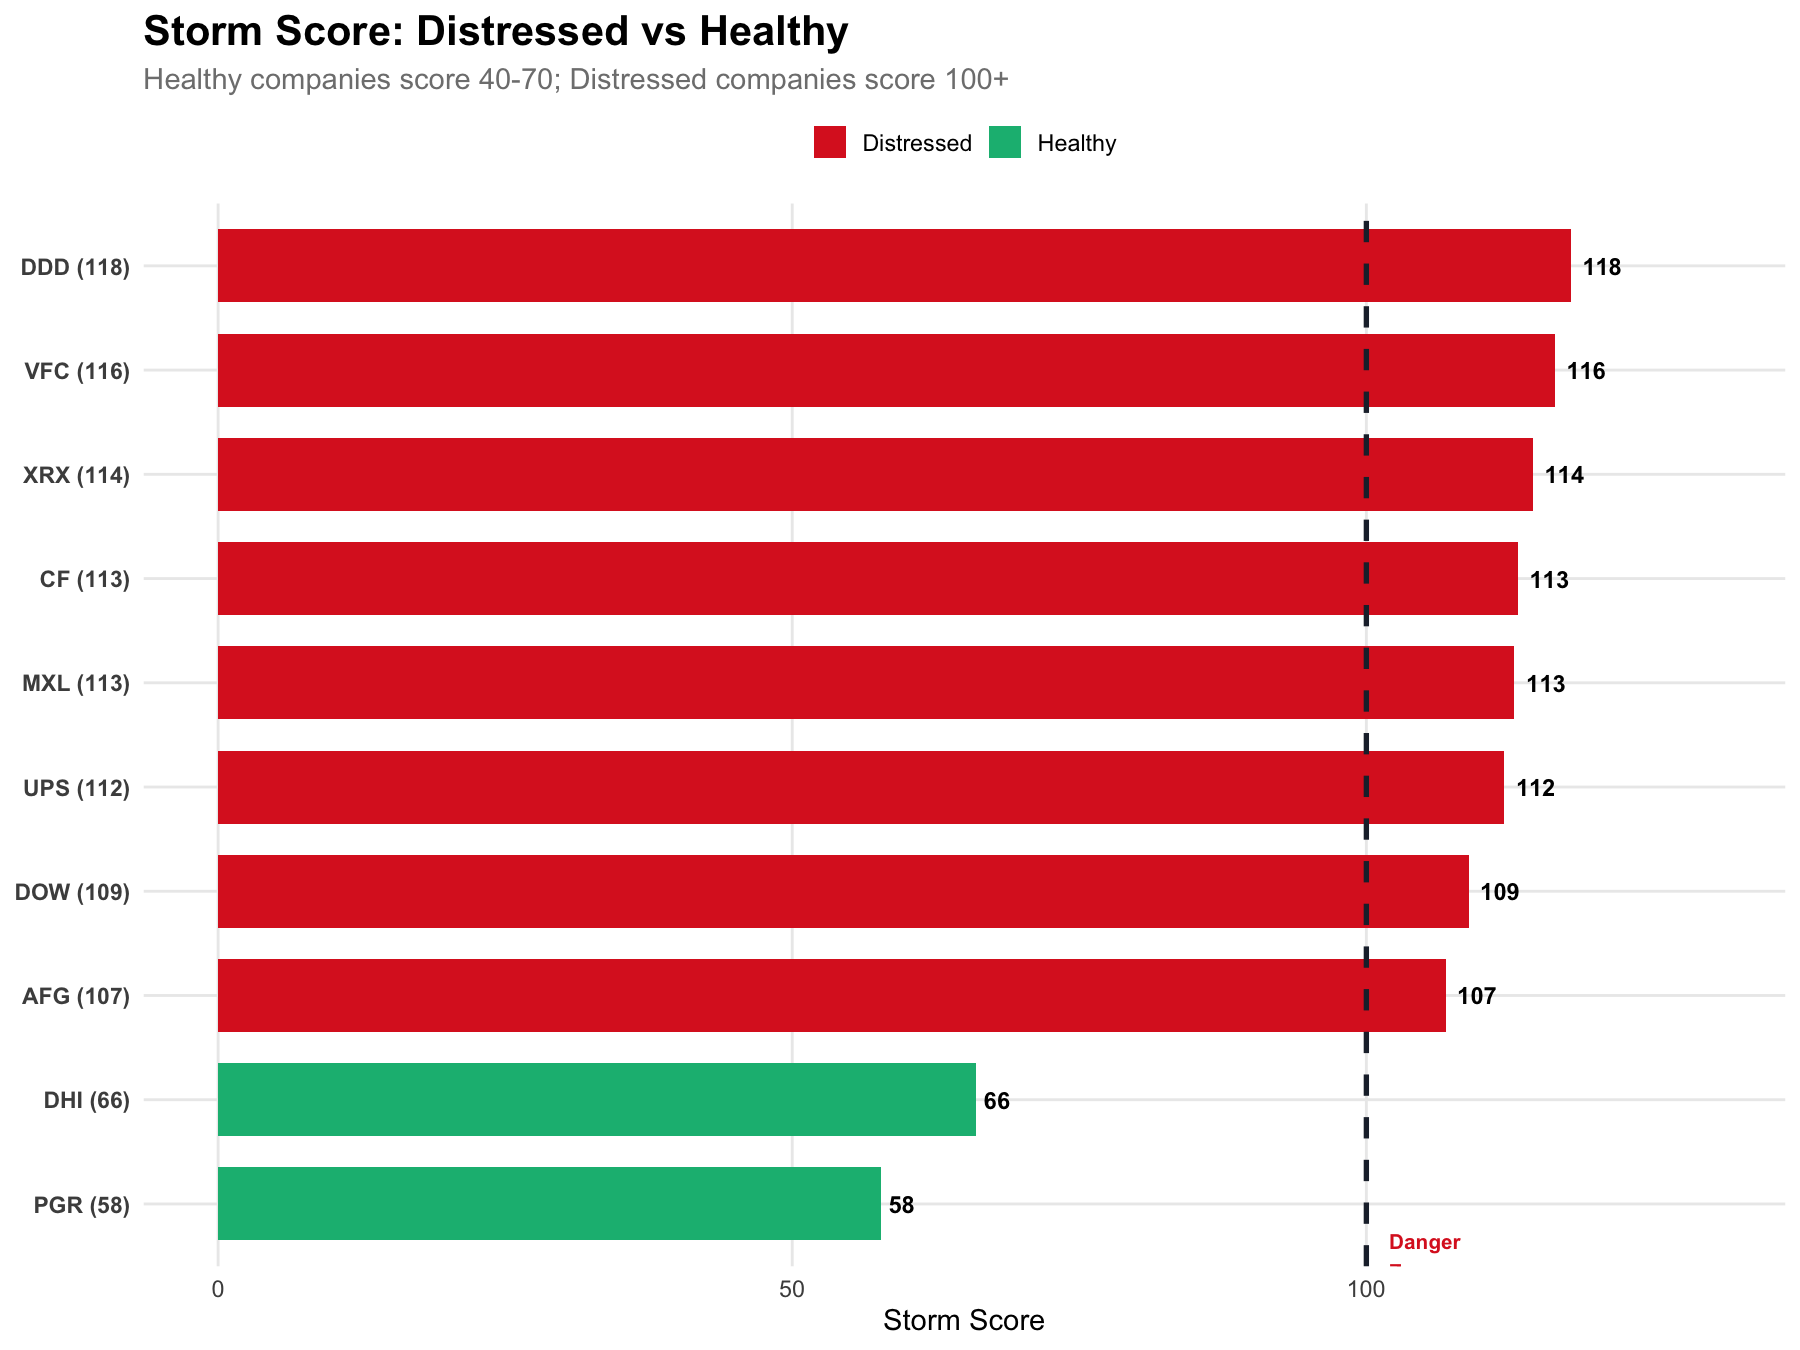
Distressed vs Healthy Comparison
Compare signal intensity between distressed companies (top) and healthy companies like D.R. Horton and Progressive (bottom). Notice how distressed companies show elevated signals across all dimensions.
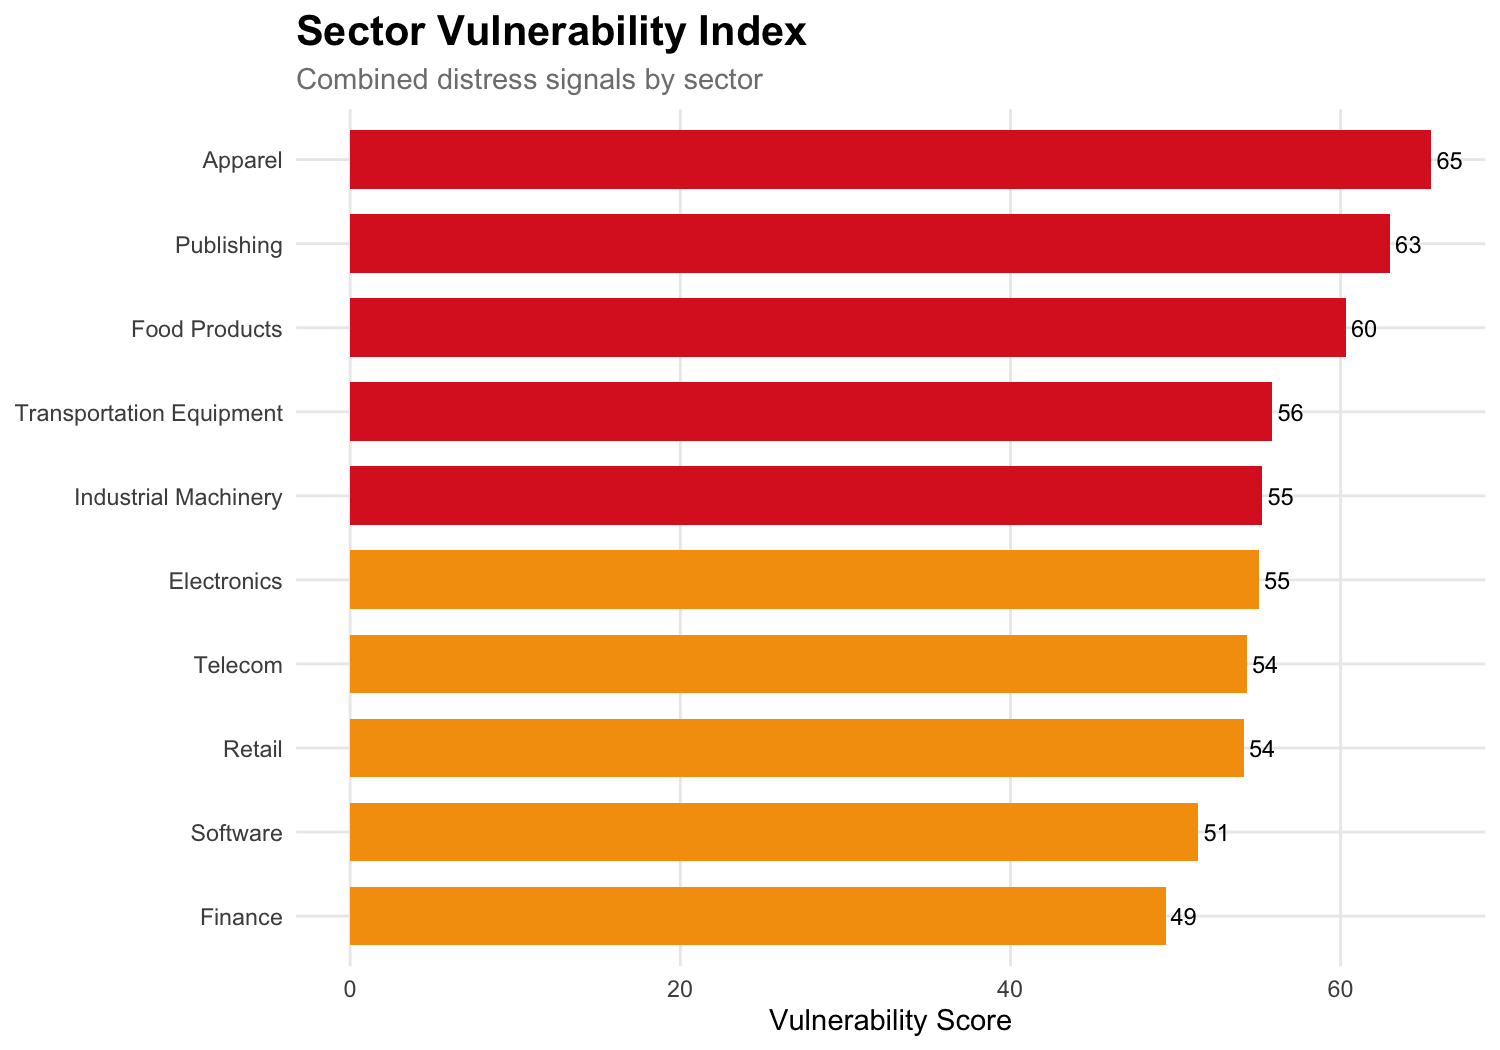
Sector Vulnerability
Which sectors show the most distress signals? Avoid shorting strong sectors; focus on weakness.
Storm Score Distribution
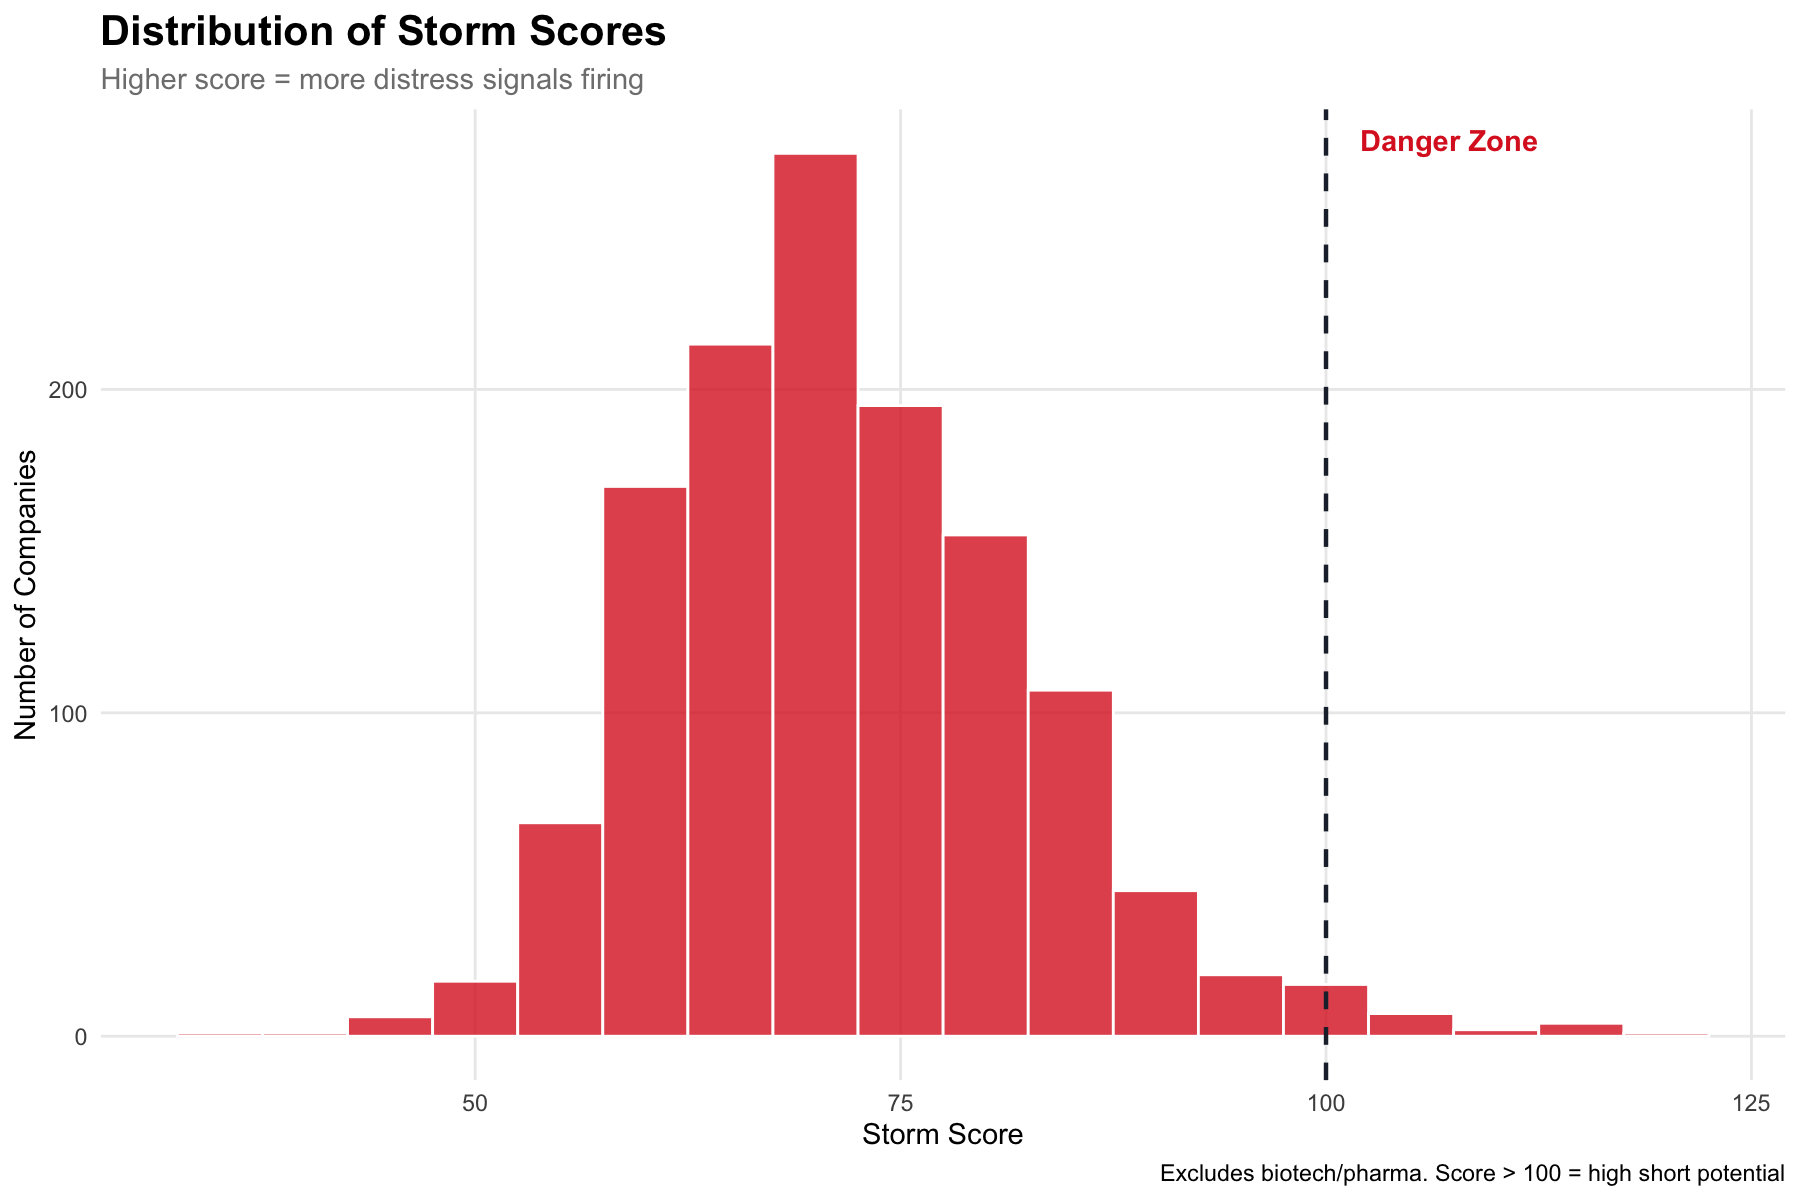
Most companies cluster below 80. Scores above 100 represent the tail—companies with genuinely elevated distress across multiple dimensions.
Key Observations
📉 3D Printing Collapse
DDD (3D Systems) leads the list. The 3D printing hype of 2020-2021 has fully unwound. Revenue declining + massive cost cutting.
👔 Apparel Struggles
VFC (Vans, North Face) shows persistent weakness. Consumer discretionary spending pullback hitting hard.
🖨️ Legacy Tech
XRX (Xerox) continues secular decline. Print volumes falling, remote work permanent.
Signals Used
📉 Revenue Declining
is_revenue_declining
Language about declining sales, revenue drops, volume decreases
✂️ Cost Cutting
is_cost_cutting
Restructuring, layoffs, expense reduction initiatives
😟 Missing Expectations
is_below_expectations
Language about falling short, missing targets, below guidance
🤔 Hedging Language
is_cautious_or_hedging_tone
Cautious, uncertain, hedged statements from management
Future Enhancements
is_inventory_buildup — channel stuffing detectionis_margin_compression — pricing pressure signalsis_customer_concentration_risk — key customer dependencyis_debt_covenant_concern — covenant waiver languageis_auditor_concern — material weakness, going concern emphasis