First Derivative Analysis

Momentum
Matters

Linear regression tells you where a company is headed. But it misses the turning points. Velocity — the first derivative — tells you when momentum shifts. That's often the only signal that matters.


The Physics

Position vs. Velocity — a ball in flight

Think of a ball thrown upward. At its peak, position is highest — but velocity is zero, about to go negative. Linear regression at that moment says "going up!" Velocity says "about to come down."

📍

Position (Linear Regression)

Where is the company right now? What's the overall trend direction? Good for understanding current state, but blind to turning points.

Misses inflection points
🚀

Velocity (First Derivative)

How fast is change happening? Which direction is momentum? Captures acceleration and deceleration — sees turns before they complete.

Predicts reversals
Question Linear Regression vs Velocity Analysis
What does it measure? Overall direction Rate of change
What does it miss? Curves, turning points Long-term direction
Best for... Confirming trends Timing decisions
Warning signal Slope turns negative Velocity turns negative (earlier!)

Reading the Charts

Two panels, two stories

Each chart has two panels. The top shows the smooth trajectory. The bottom shows the velocity — how fast things are changing at each point in time.

Top Panel Gap with Spline

The blue curve is a smooth spline fit through the data points. It captures non-linear movement that a straight regression line would miss. The gray dots are individual filings.

Bottom Panel Velocity

The first derivative of the spline. Green fill = improving faster. Red fill = worsening faster. The line crosses zero at inflection points.

Green Velocity

Positive velocity means the gap (positive signals minus negative signals) is increasing. The company is improving, and the rate of improvement is captured by the height.

Red Velocity

Negative velocity means the gap is shrinking or going negative. Even if position is still positive, red velocity warns that momentum has shifted — trouble may be coming.


Live Readings

Current velocity signals

KZR
Kezar Life Sciences
-0.028/yr
Current Velocity
Peak: +0.042/yr (Nov 2020)
Trough: -0.050/yr (May 2023)
COSM
Cosmos Health
-0.024/yr
Current Velocity
Peak: +0.032/yr (Aug 2018)
Trough: -0.033/yr (Nov 2019)
IRBT
iRobot Corp
-0.018/yr
Current Velocity
Peak: +0.035/yr (Feb 2015)
Trough: -0.044/yr (Aug 2017)

Case Studies

Velocity in action

Vertex (VRTX) — The Turn at the Top

Momentum Shifted
VRTX velocity chart
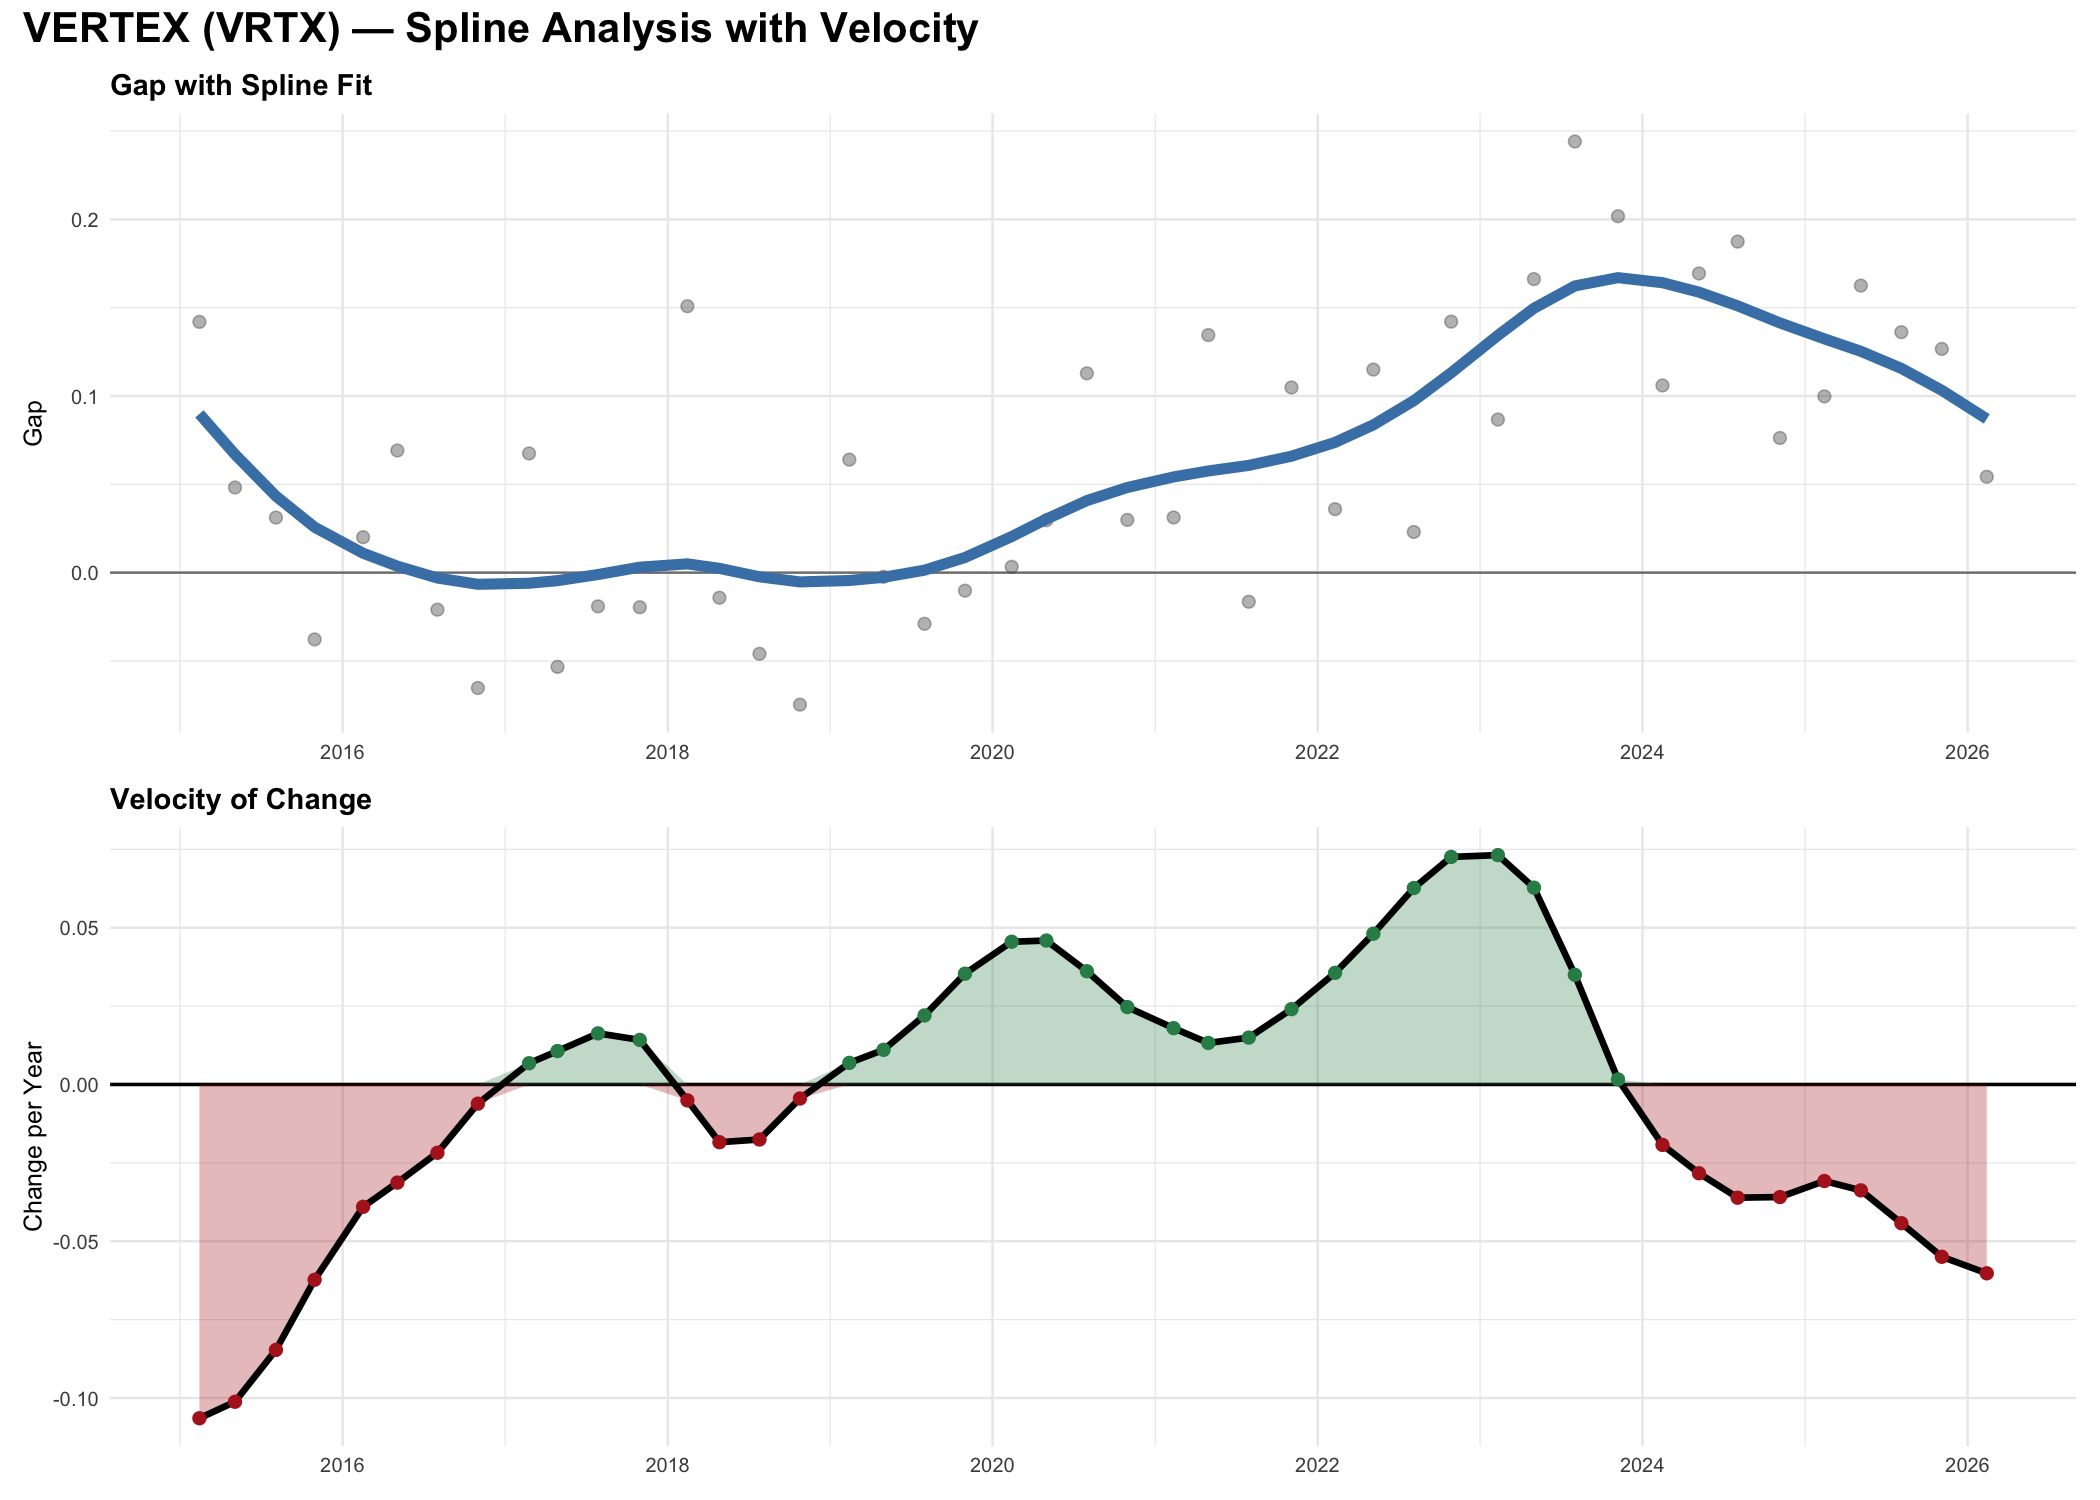
Linear regression says "upward trend, buy." Velocity tells a different story: peak momentum was February 2023 at +0.073/yr. Now velocity is negative (-0.060/yr). The company is still healthy (position is positive), but the best days may be behind. The ball has crested.

Kezar (KZR) — Accelerating Decline

Death Spiral
KZR velocity chart
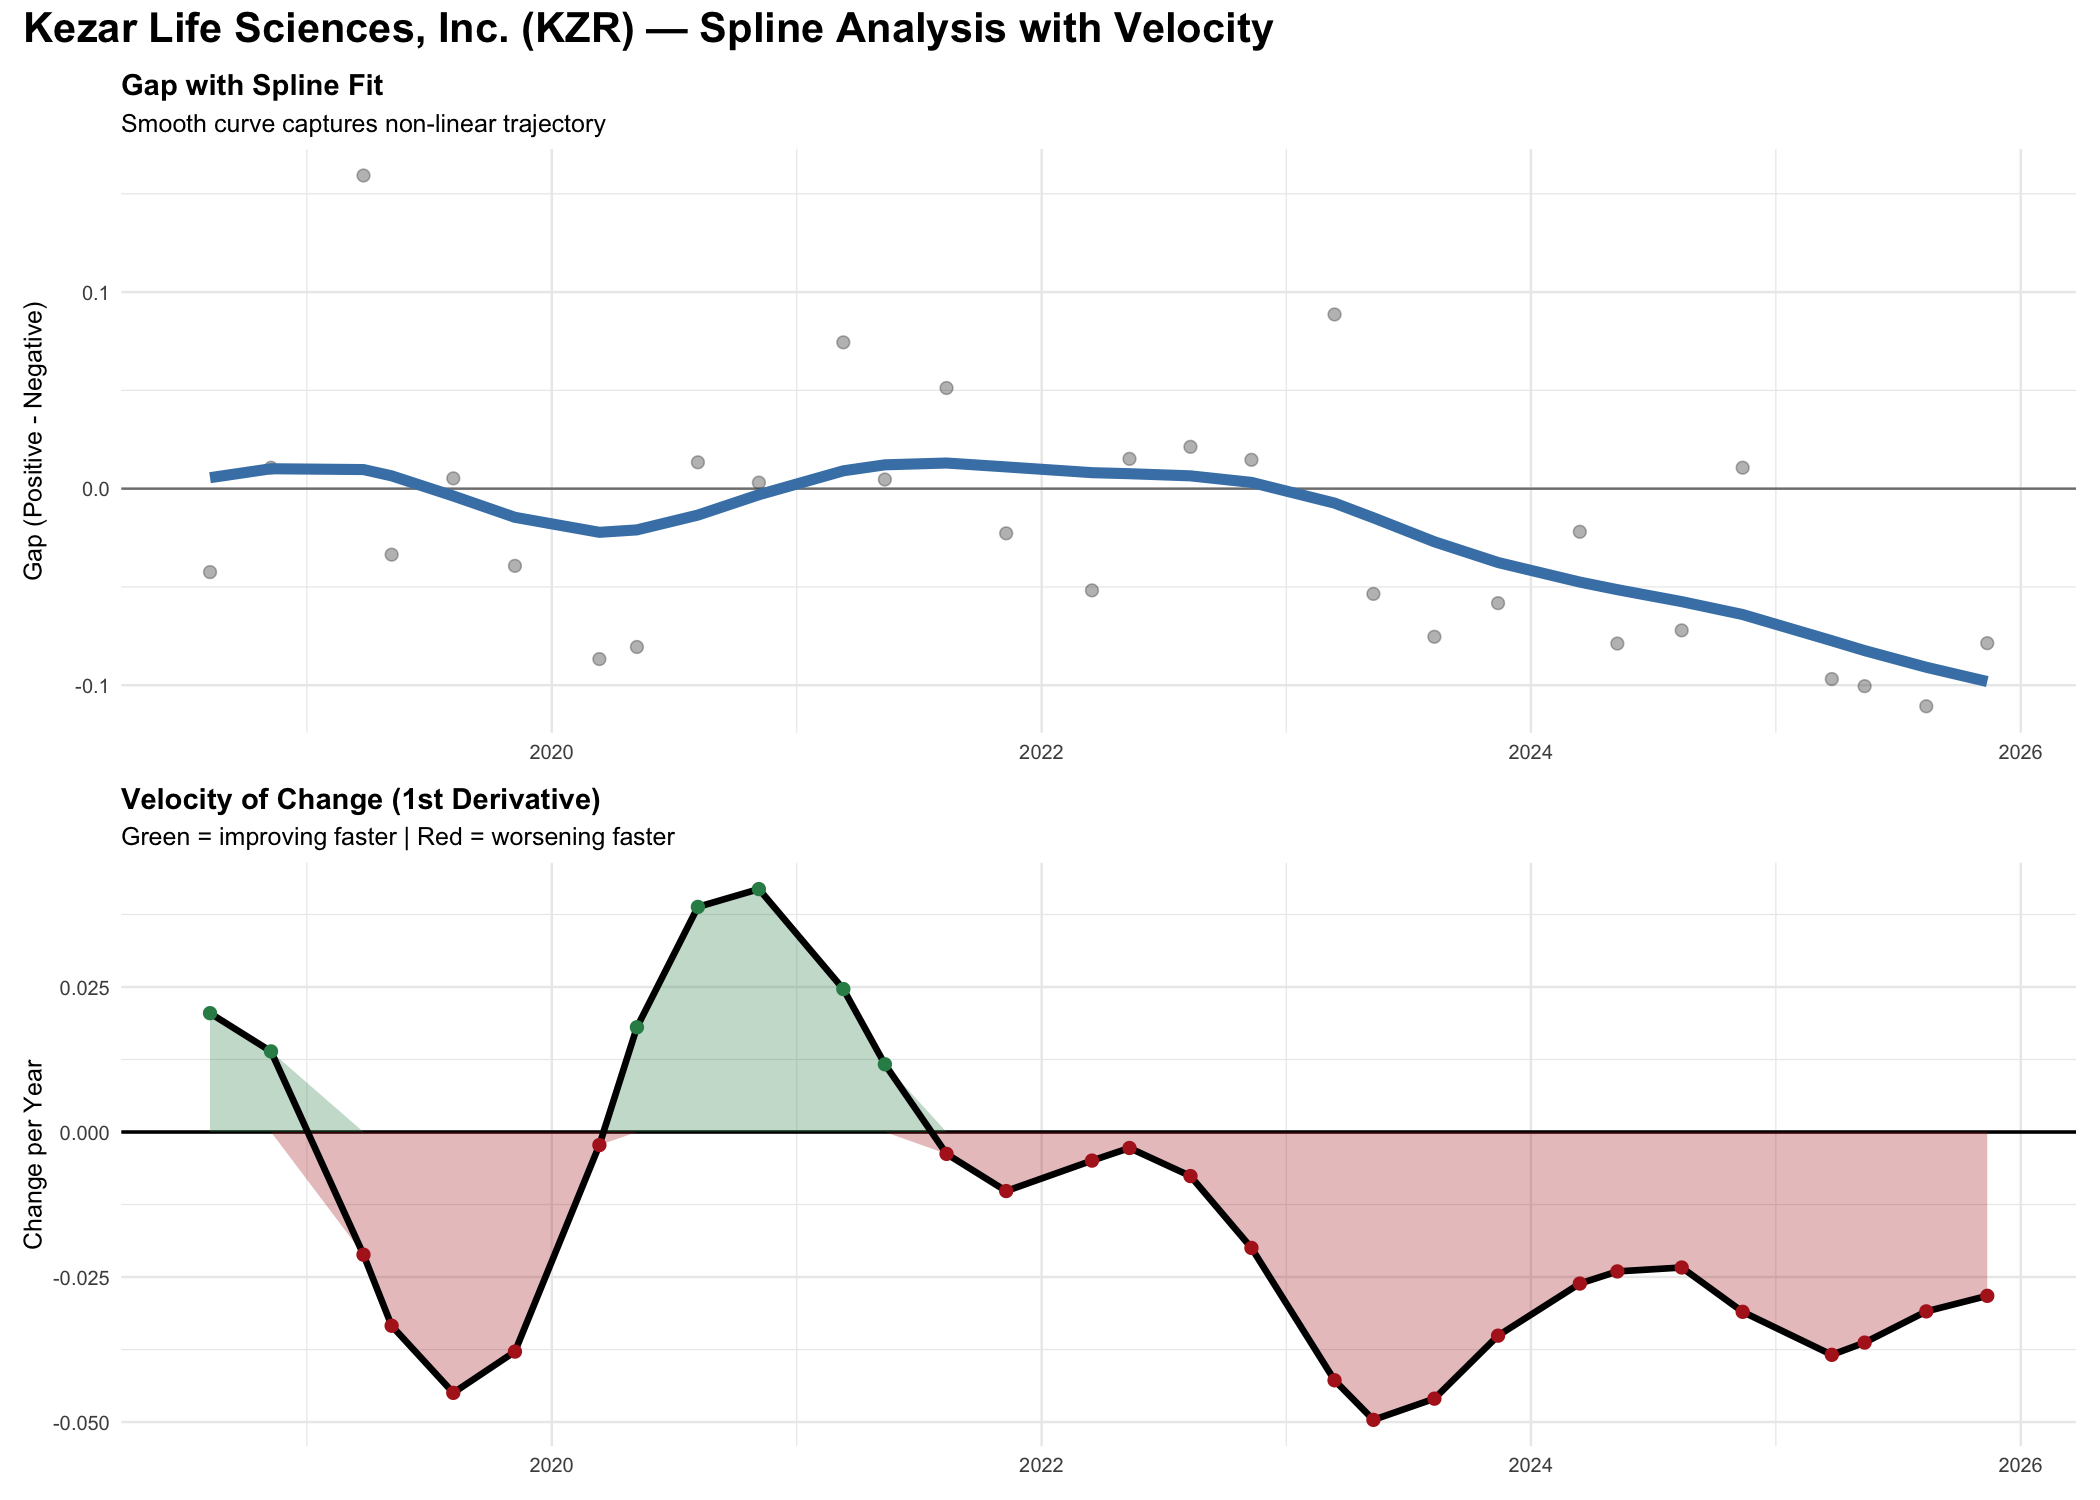
KZR had a brief moment of hope in late 2020 (velocity peaked at +0.042/yr). But by May 2023, velocity hit -0.050/yr — the fastest rate of decline in the dataset. The bottom panel is almost entirely red. This is structural deterioration, not a temporary setback.

Novavax (NVAX) — The COVID Spike

Boom and Bust
NVAX velocity chart
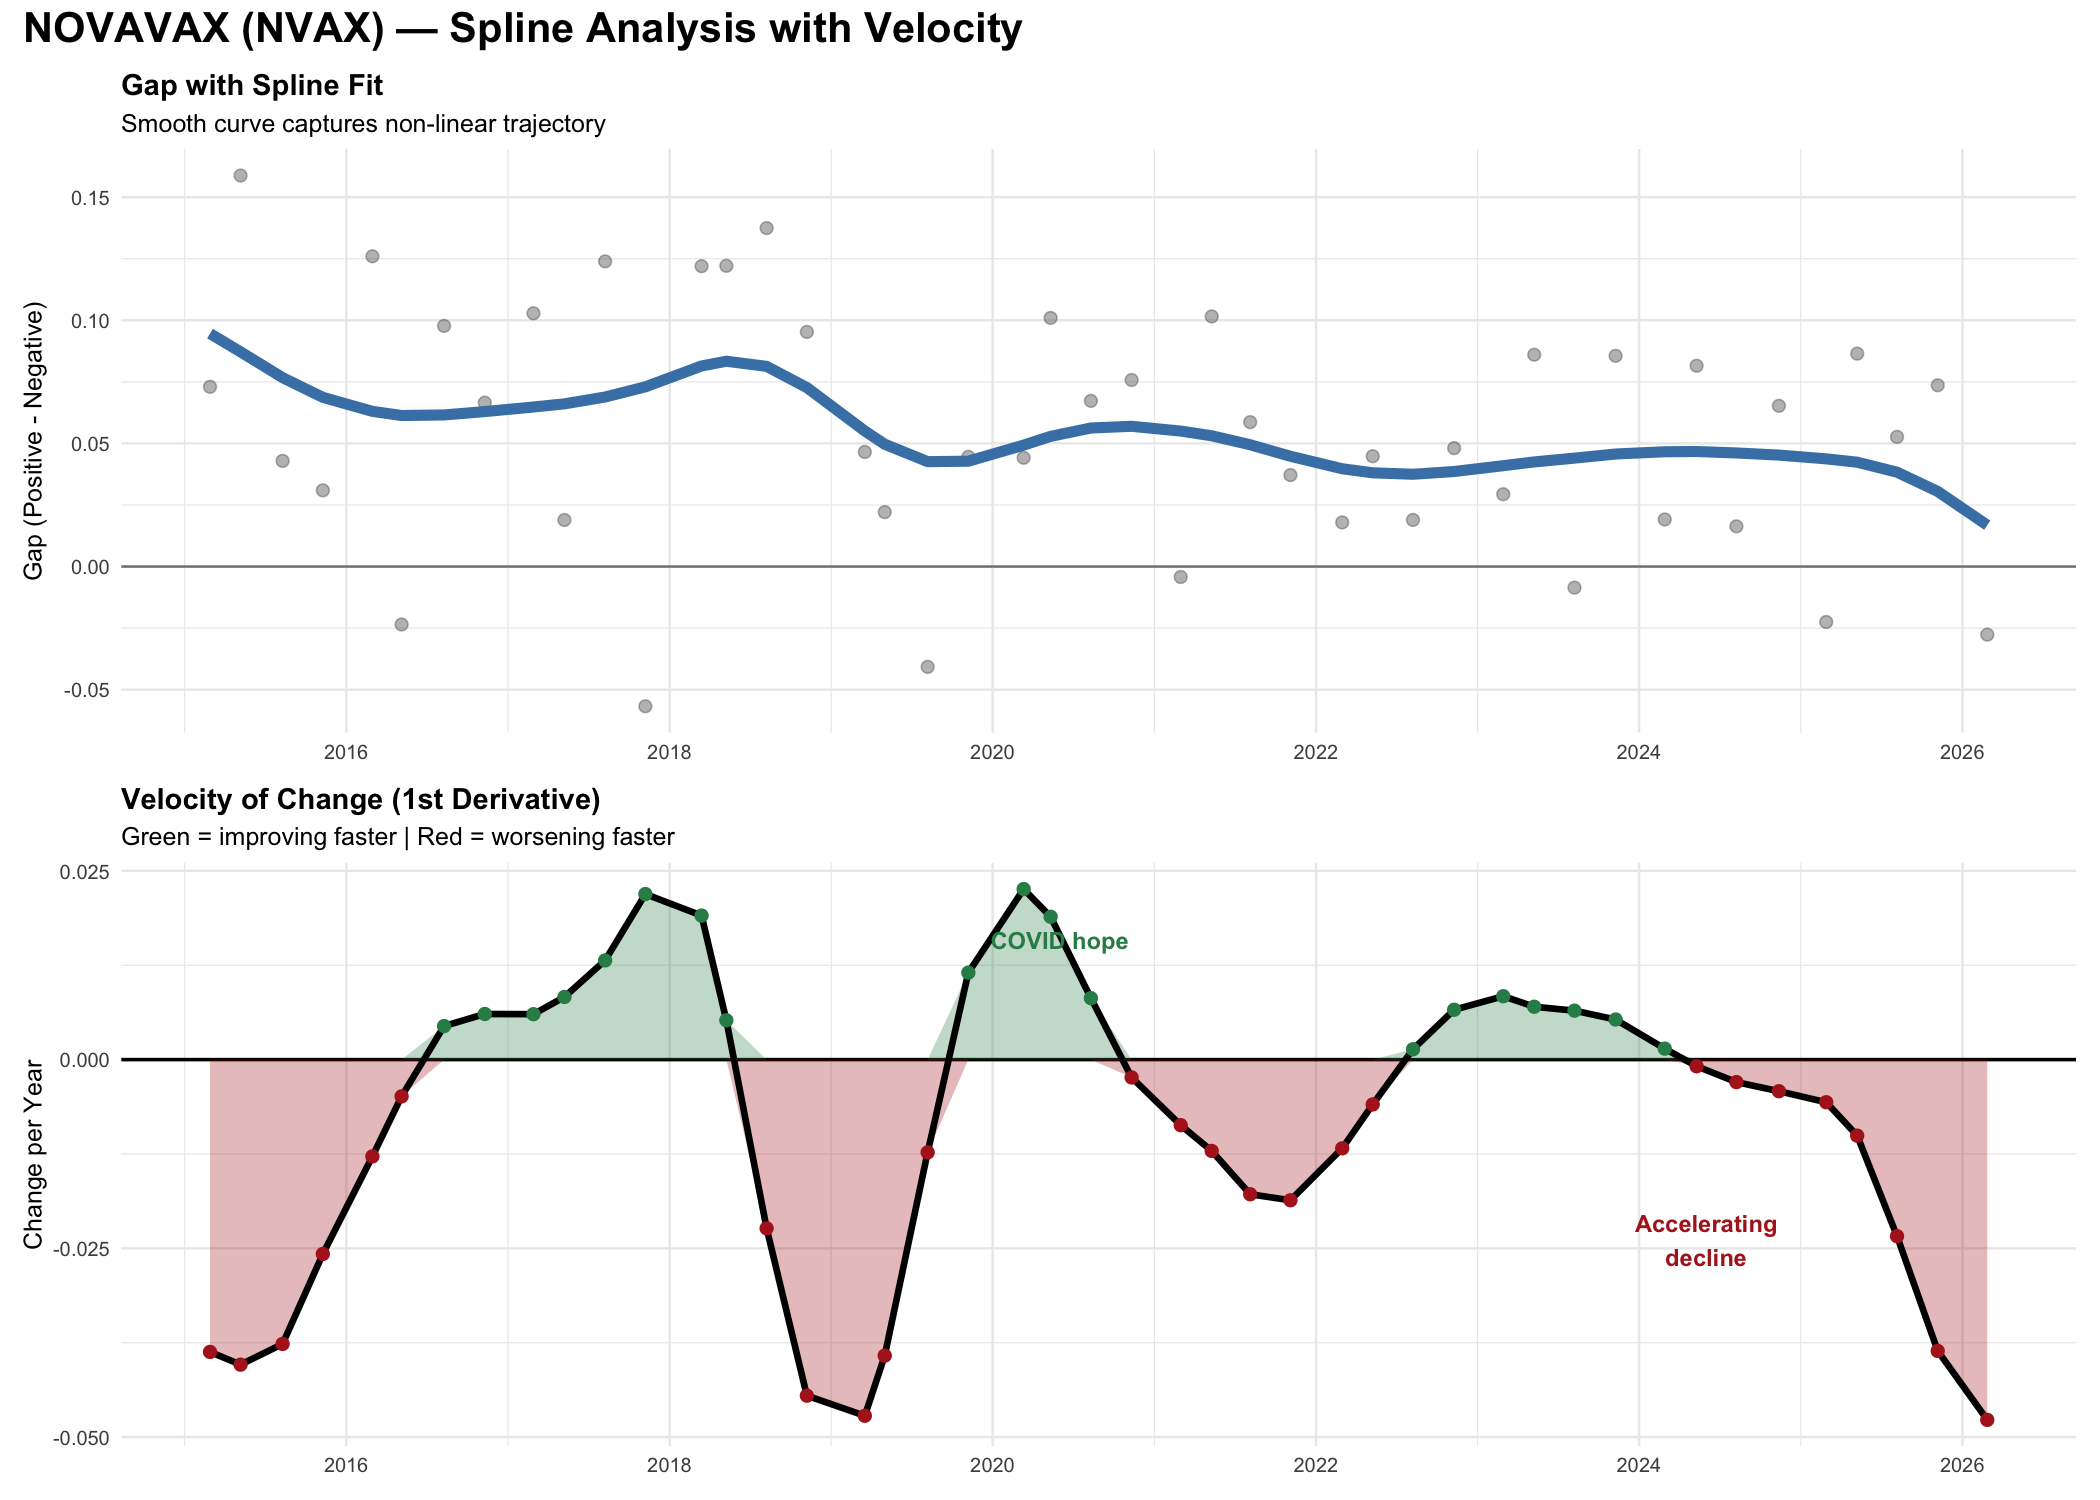
The COVID vaccine hope is visible as a sharp green spike in early 2020. But velocity collapsed almost immediately. By the time the market realized NVAX wasn't delivering, the velocity signal had been red for quarters. Position lagged; velocity led.

iRobot (IRBT) — Long Decline

Structural Shift
IRBT velocity chart
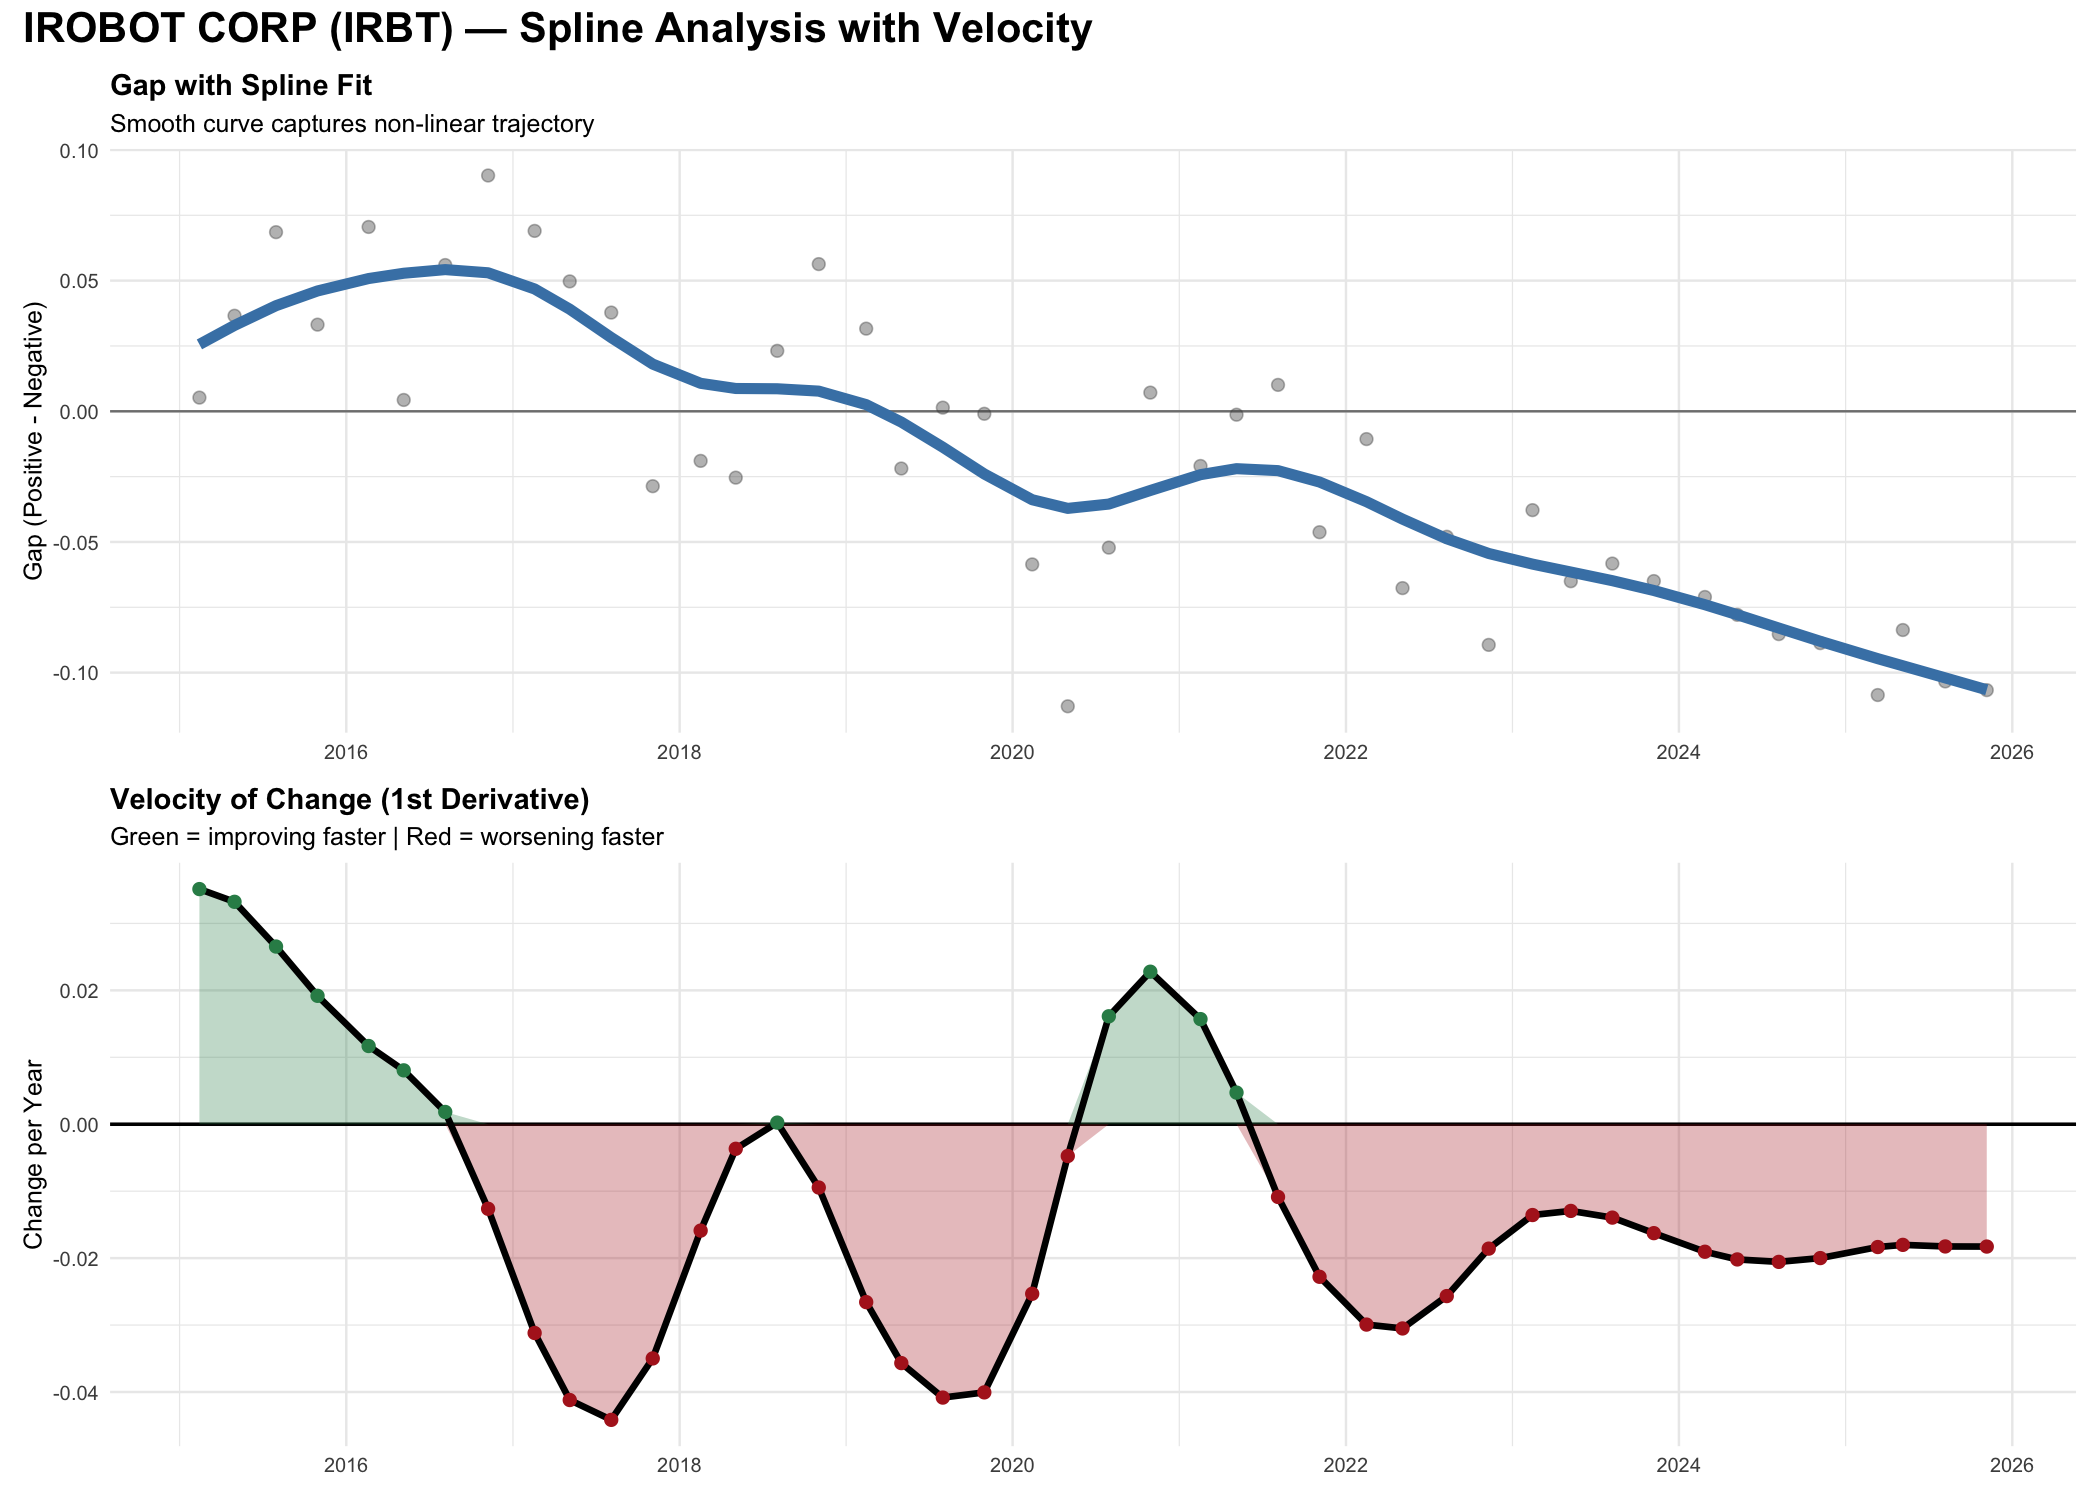
iRobot peaked in 2015 and has been in gradual decline since. The velocity panel shows mostly red from 2016 onward. The Amazon deal collapse didn't cause the decline — the velocity signal showed structural problems years earlier.

The key insight: Velocity often turns negative while position is still positive. A company can look healthy on the surface (gap > 0) while momentum is already shifting (velocity < 0). This is the "ball at its peak" moment — highest position, zero or negative velocity. The regression line says hold; the velocity says consider selling.

Technical details

Spline Fitting

Smooth splines with spar = 0.6 balance flexibility and smoothness. Higher values = smoother curves. Captures non-linear trajectories that linear regression misses.

Velocity Calculation

First derivative of the spline, multiplied by 365 to express as "change per year." Positive = improving faster. Negative = worsening faster.

Gap Definition

Mean of 9 positive signals minus mean of 9 negative signals, normalized by sentence count. Positive gap = more good news than bad. Negative gap = distress dominates.

Positive Signals

positive_outcome, indication_expansion, accelerated_timeline, regulatory_milestone, approval_event, clinical_trial_milestone, revenue_growing, completed_event

Negative Signals

litigation_related, enforcement_action, regulatory_setback, negative_outcome, cost_cutting, financing_desperation, going_concern_warning, debt_related

Data Window

10-K and 10-Q filings from 2015 onwards. Minimum 4 filings required for spline fitting. Earlier data may be sparser for newer companies.