The Insight
Every quarter, companies file 10-Qs and 10-Ks filled with language about performance relative to expectations. We measure the balance of "above expectations" vs "below expectations" language to create a Net Beat Score.
Key finding: Tone is sticky. Companies that consistently use positive language tend to keep beating expectations. Companies that hedge and qualify tend to keep missing.
How It Works
Tone by Sector
Different industries have different baseline tones. Construction and Finance lead; Telecom lags.
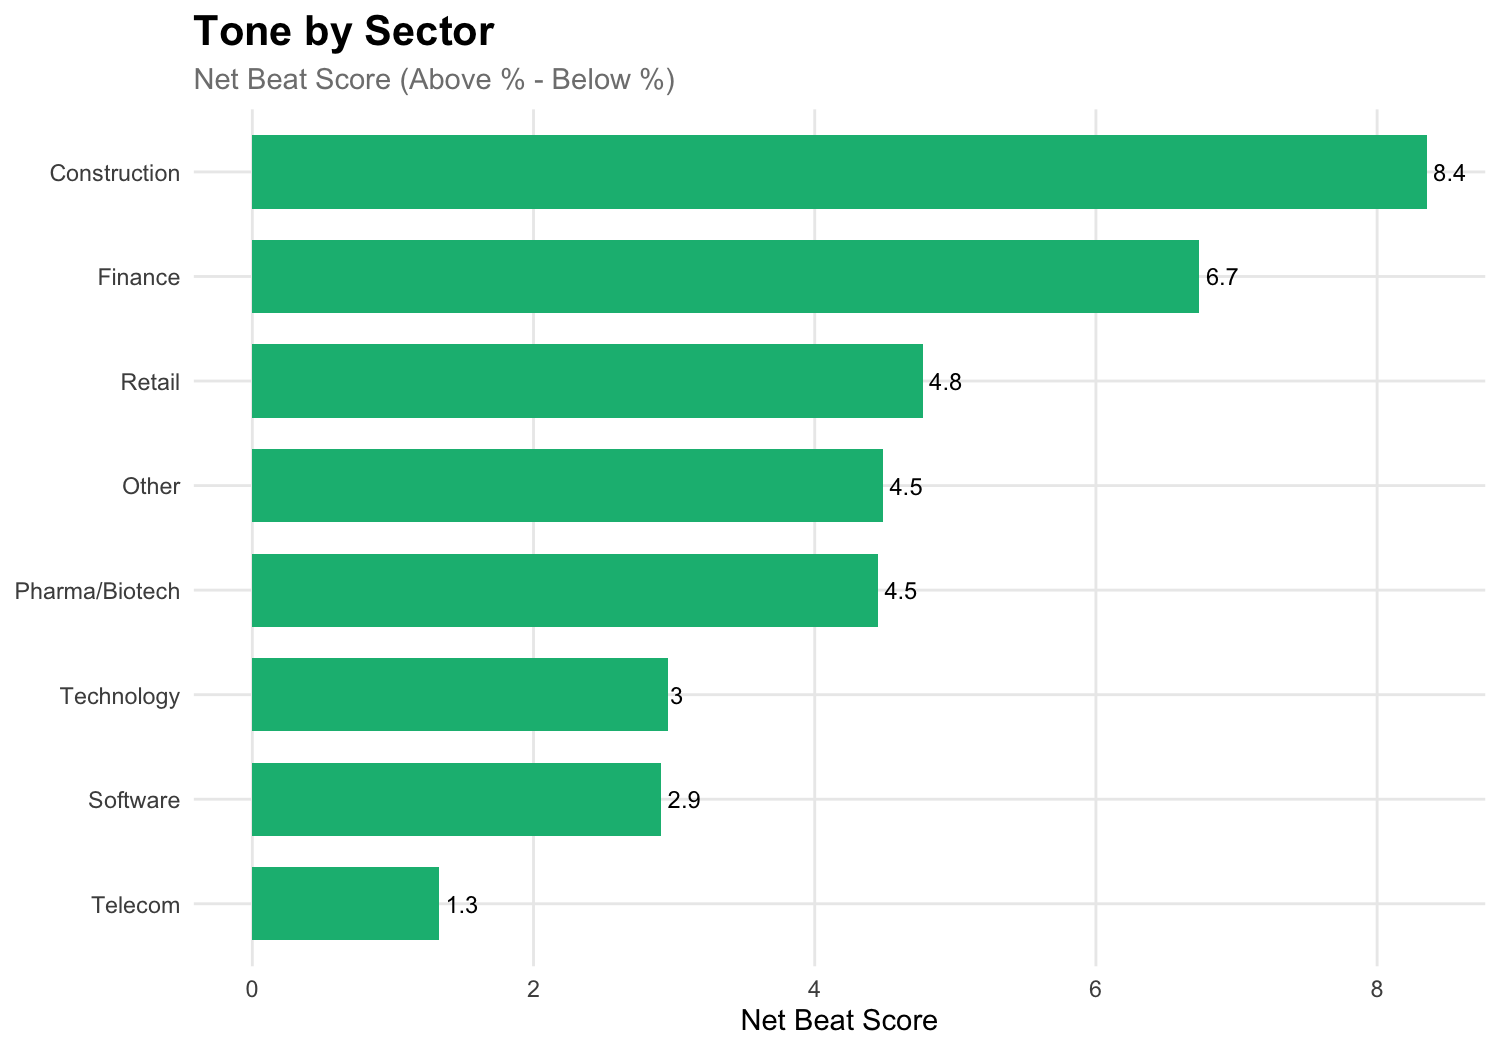
Construction (+8.4): Homebuilders like D.R. Horton consistently exceed targets in strong housing markets.
Finance (+6.7): Banks discuss exceeding capital ratios, loan growth targets, and efficiency metrics.
Telecom (+1.3): Legacy telecoms face secular decline; management naturally hedges more.
Market-Wide Tone Over Time
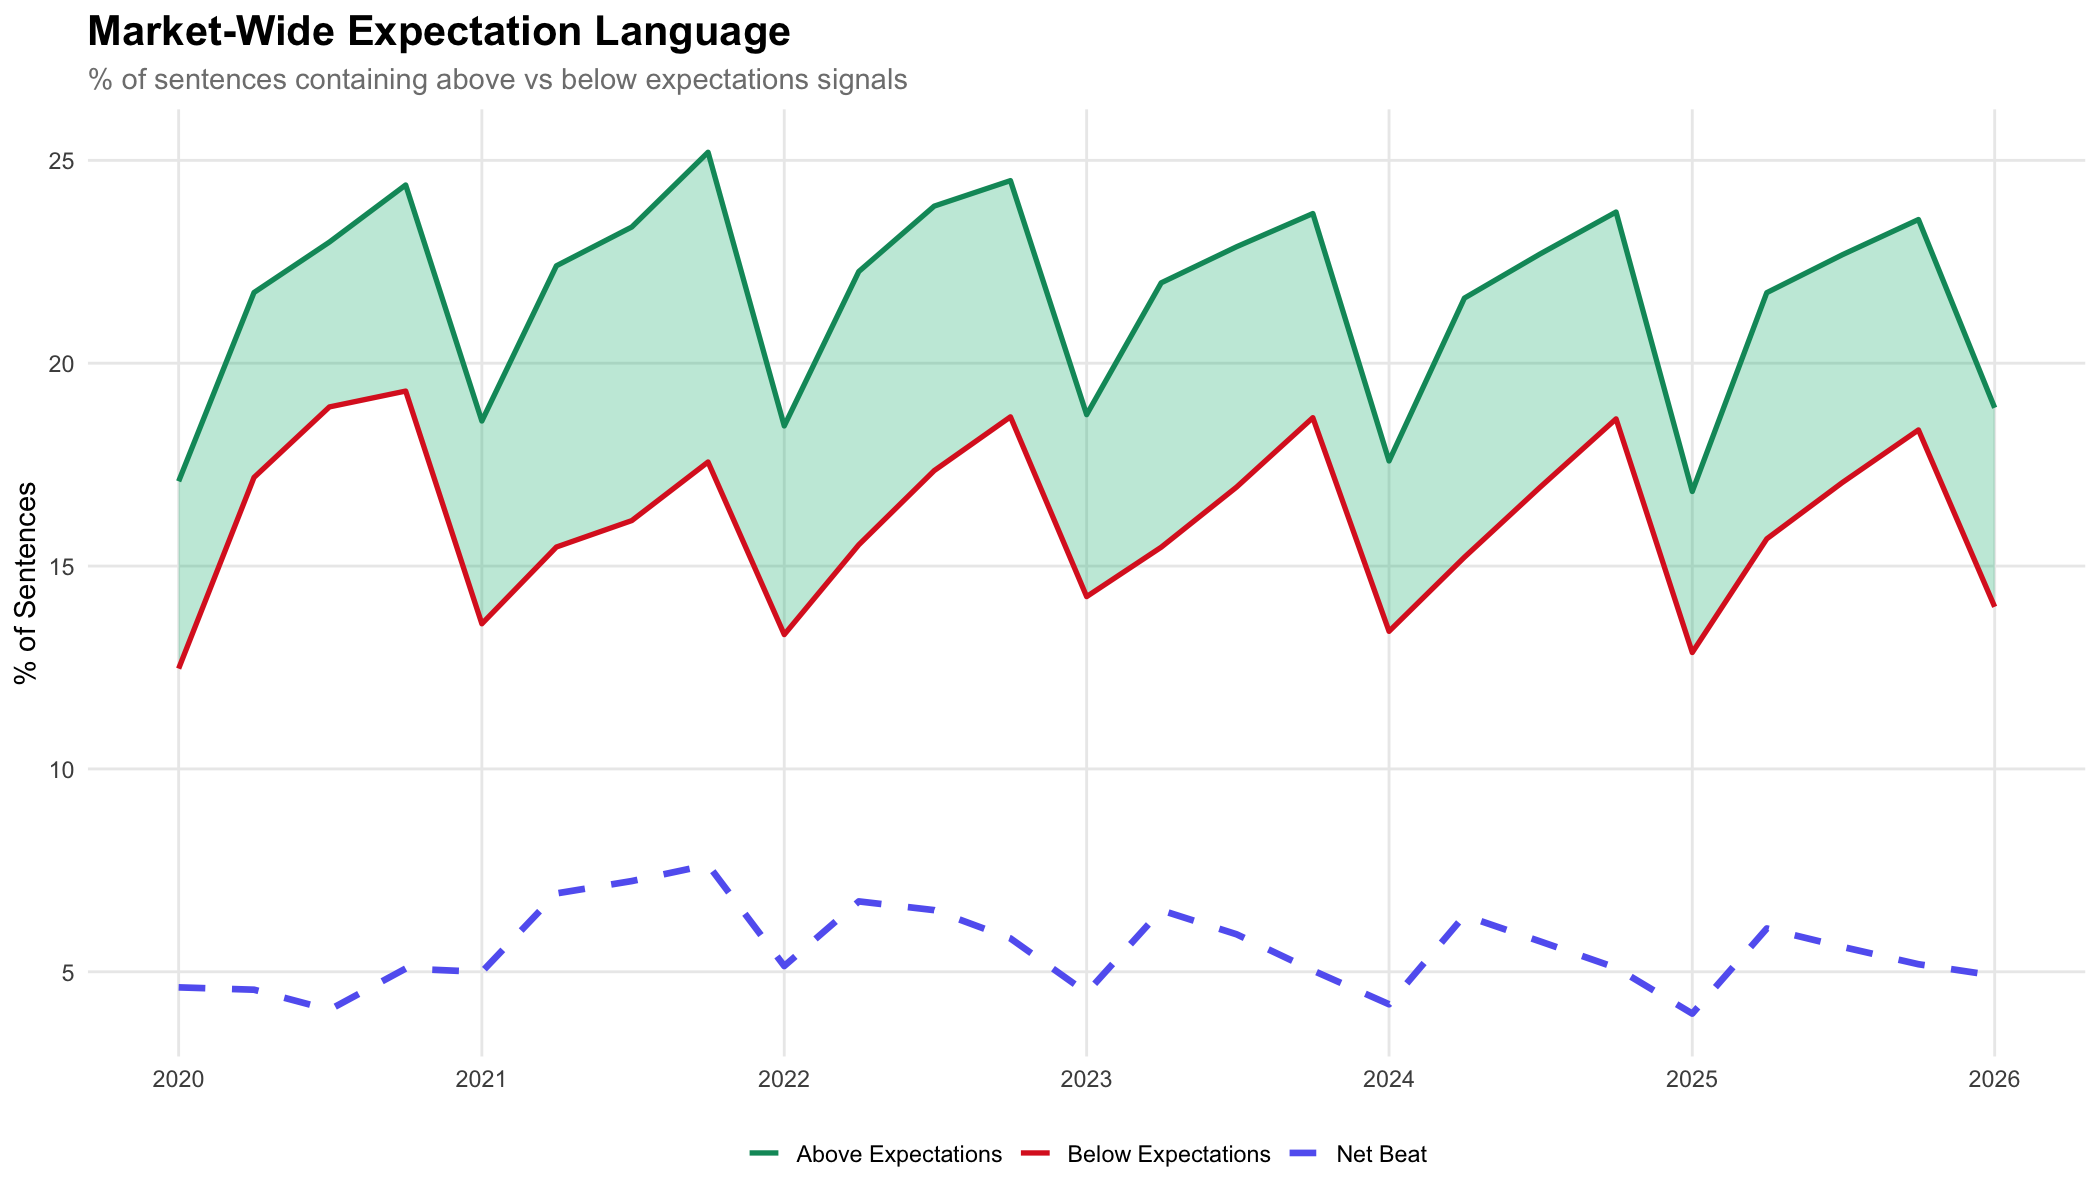
The gap between "above" and "below" language shows collective market confidence. Notice how Q1 filings (annual reports) show lower scores than Q2-Q4 (quarterly updates).
Leaders & Laggards
🏆 Tone Leaders
Companies with consistently positive language (13/13 quarters positive)
| Ticker | Company | Net Beat |
|---|---|---|
| DHI | D.R. Horton | +18.0 |
| CFR | Cullen/Frost Bankers | +17.1 |
| CINF | Cincinnati Financial | +16.3 |
| PGR | Progressive Corp | +15.3 |
| MHO | M/I Homes | +15.3 |
⚠️ Tone Laggards
Companies with persistently negative language (0-2 positive quarters)
| Ticker | Company | Net Beat |
|---|---|---|
| MAN | ManpowerGroup | -5.6 |
| COMM | CommScope | -4.4 |
| VFF | Village Farms | -3.4 |
| SIRI | SiriusXM | -3.1 |
| CGC | Canopy Growth | -2.5 |
Distribution of Company Tones
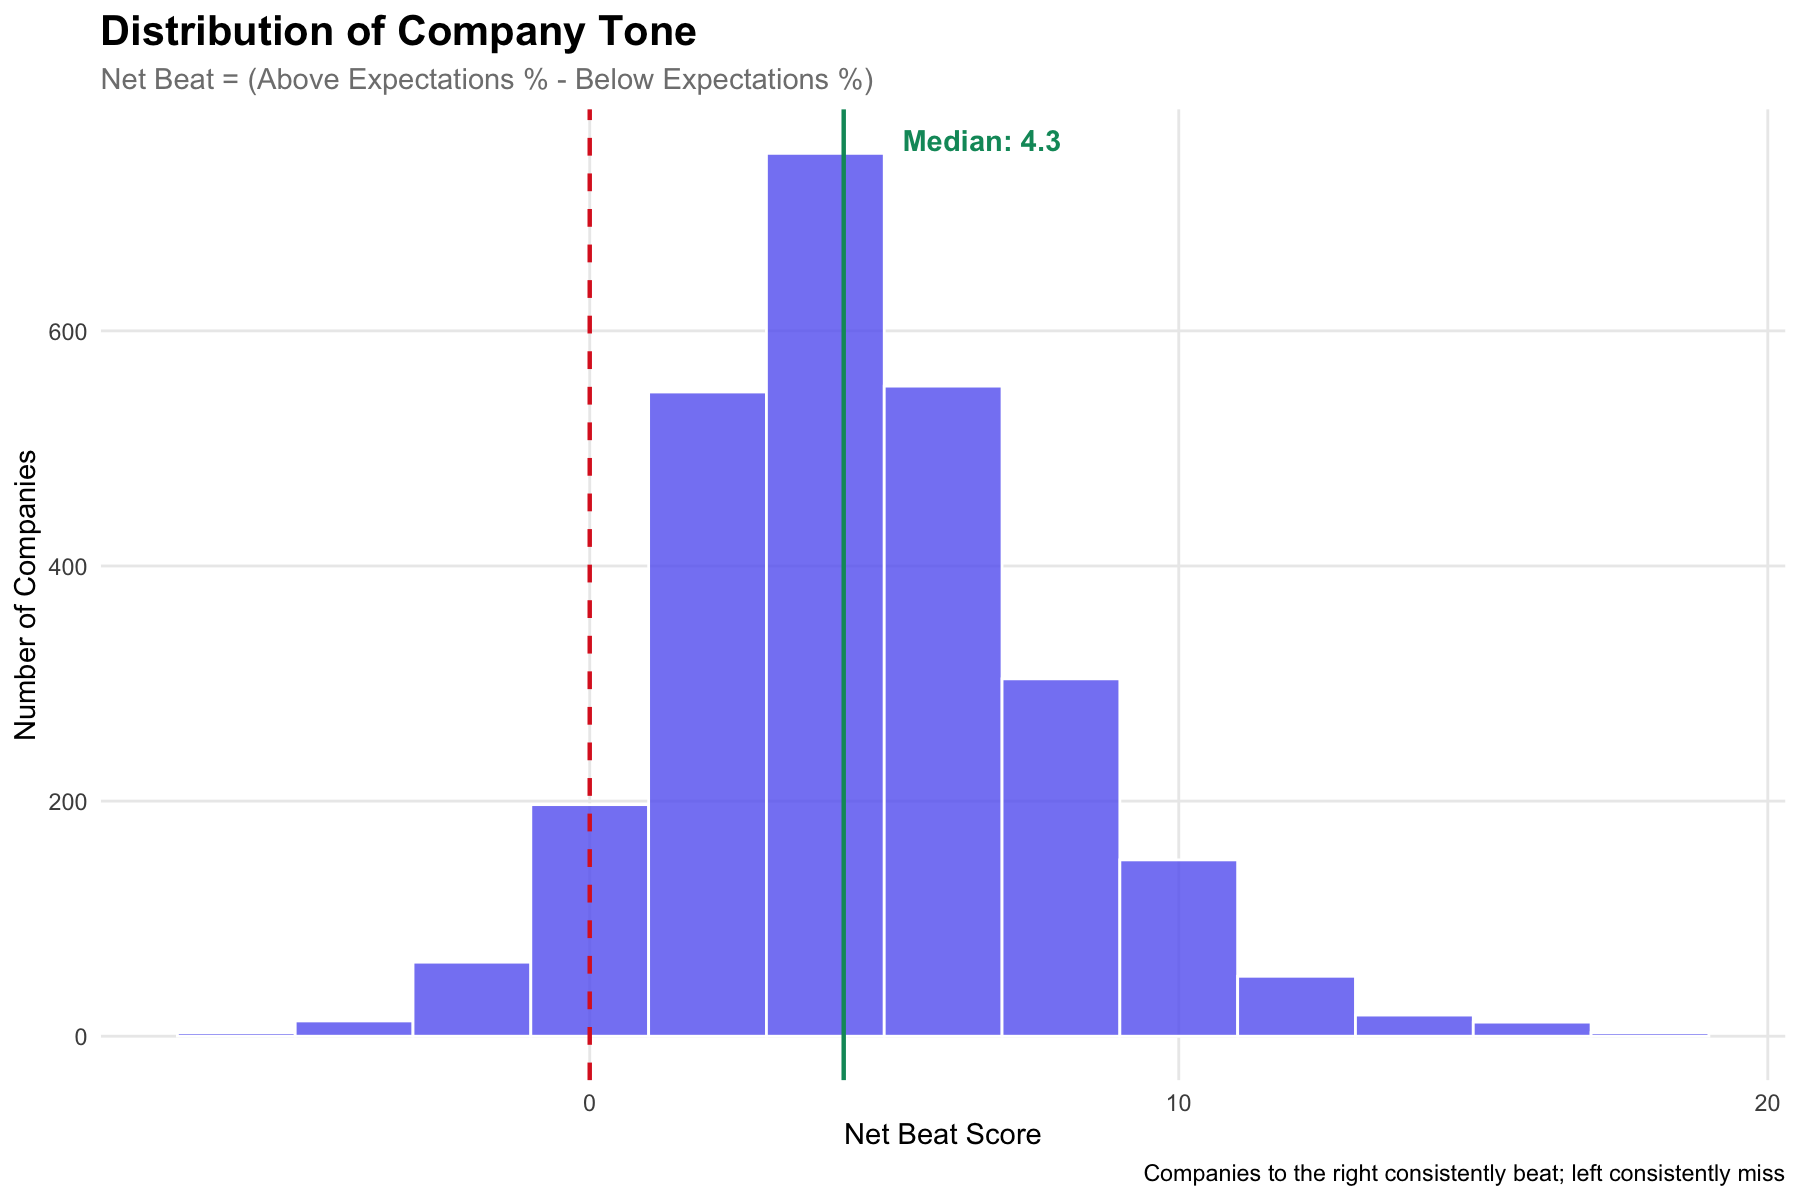
Most companies cluster around +3 to +8. Companies to the far right are persistent optimists; those on the left are chronic hedgers.
Key Observations
📊 Tone is Persistent
Companies that beat expectations in language tend to keep doing it. D.R. Horton: positive for 13 consecutive quarters. CommScope: negative for 11.
📉 Drops Usually Recover
When a company's tone drops sharply (>5 points), 90% bounce back the next quarter. The 10% that continue dropping are the real warning signs.
🎯 Guidance = Hedging
Companies with high guidance language (>35%) also show elevated hedging language. More guidance = more exposure to misses.
Methodology
Signals Used
is_above_expectations— Language about exceeding targetsis_below_expectations— Language about missing targetsis_in_line_with_expectations— Meeting but not exceedingis_about_guidance— Forward-looking projections
Calculation
- Normalize signals by sentence count
- Calculate Net Beat = Above% - Below%
- Track persistence across quarters
- Flag sudden drops (>5 point moves)
is_raising_guidance,
is_lowering_guidance,
is_withdrawing_guidance,
is_reaffirming_guidance
— These would provide more direct signals about management confidence changes.